Detailed report
Every time entry in the period, filterable, exportable, editable, lockable, and open to questions from AI Insights.
Analytics → Reports → Detailed Report is the entry-level report: one row per time entry. Users see their own. Admins see everyone's. Other report-permission holders see everyone's on the projects that show it to them (the project's Who sees all the time on this project, or View all time on a project on their role) and only their own elsewhere. Private projects they aren't on are left out unless their role has View every project. Report-permission holders can edit, move, lock, unlock and delete entries in bulk.
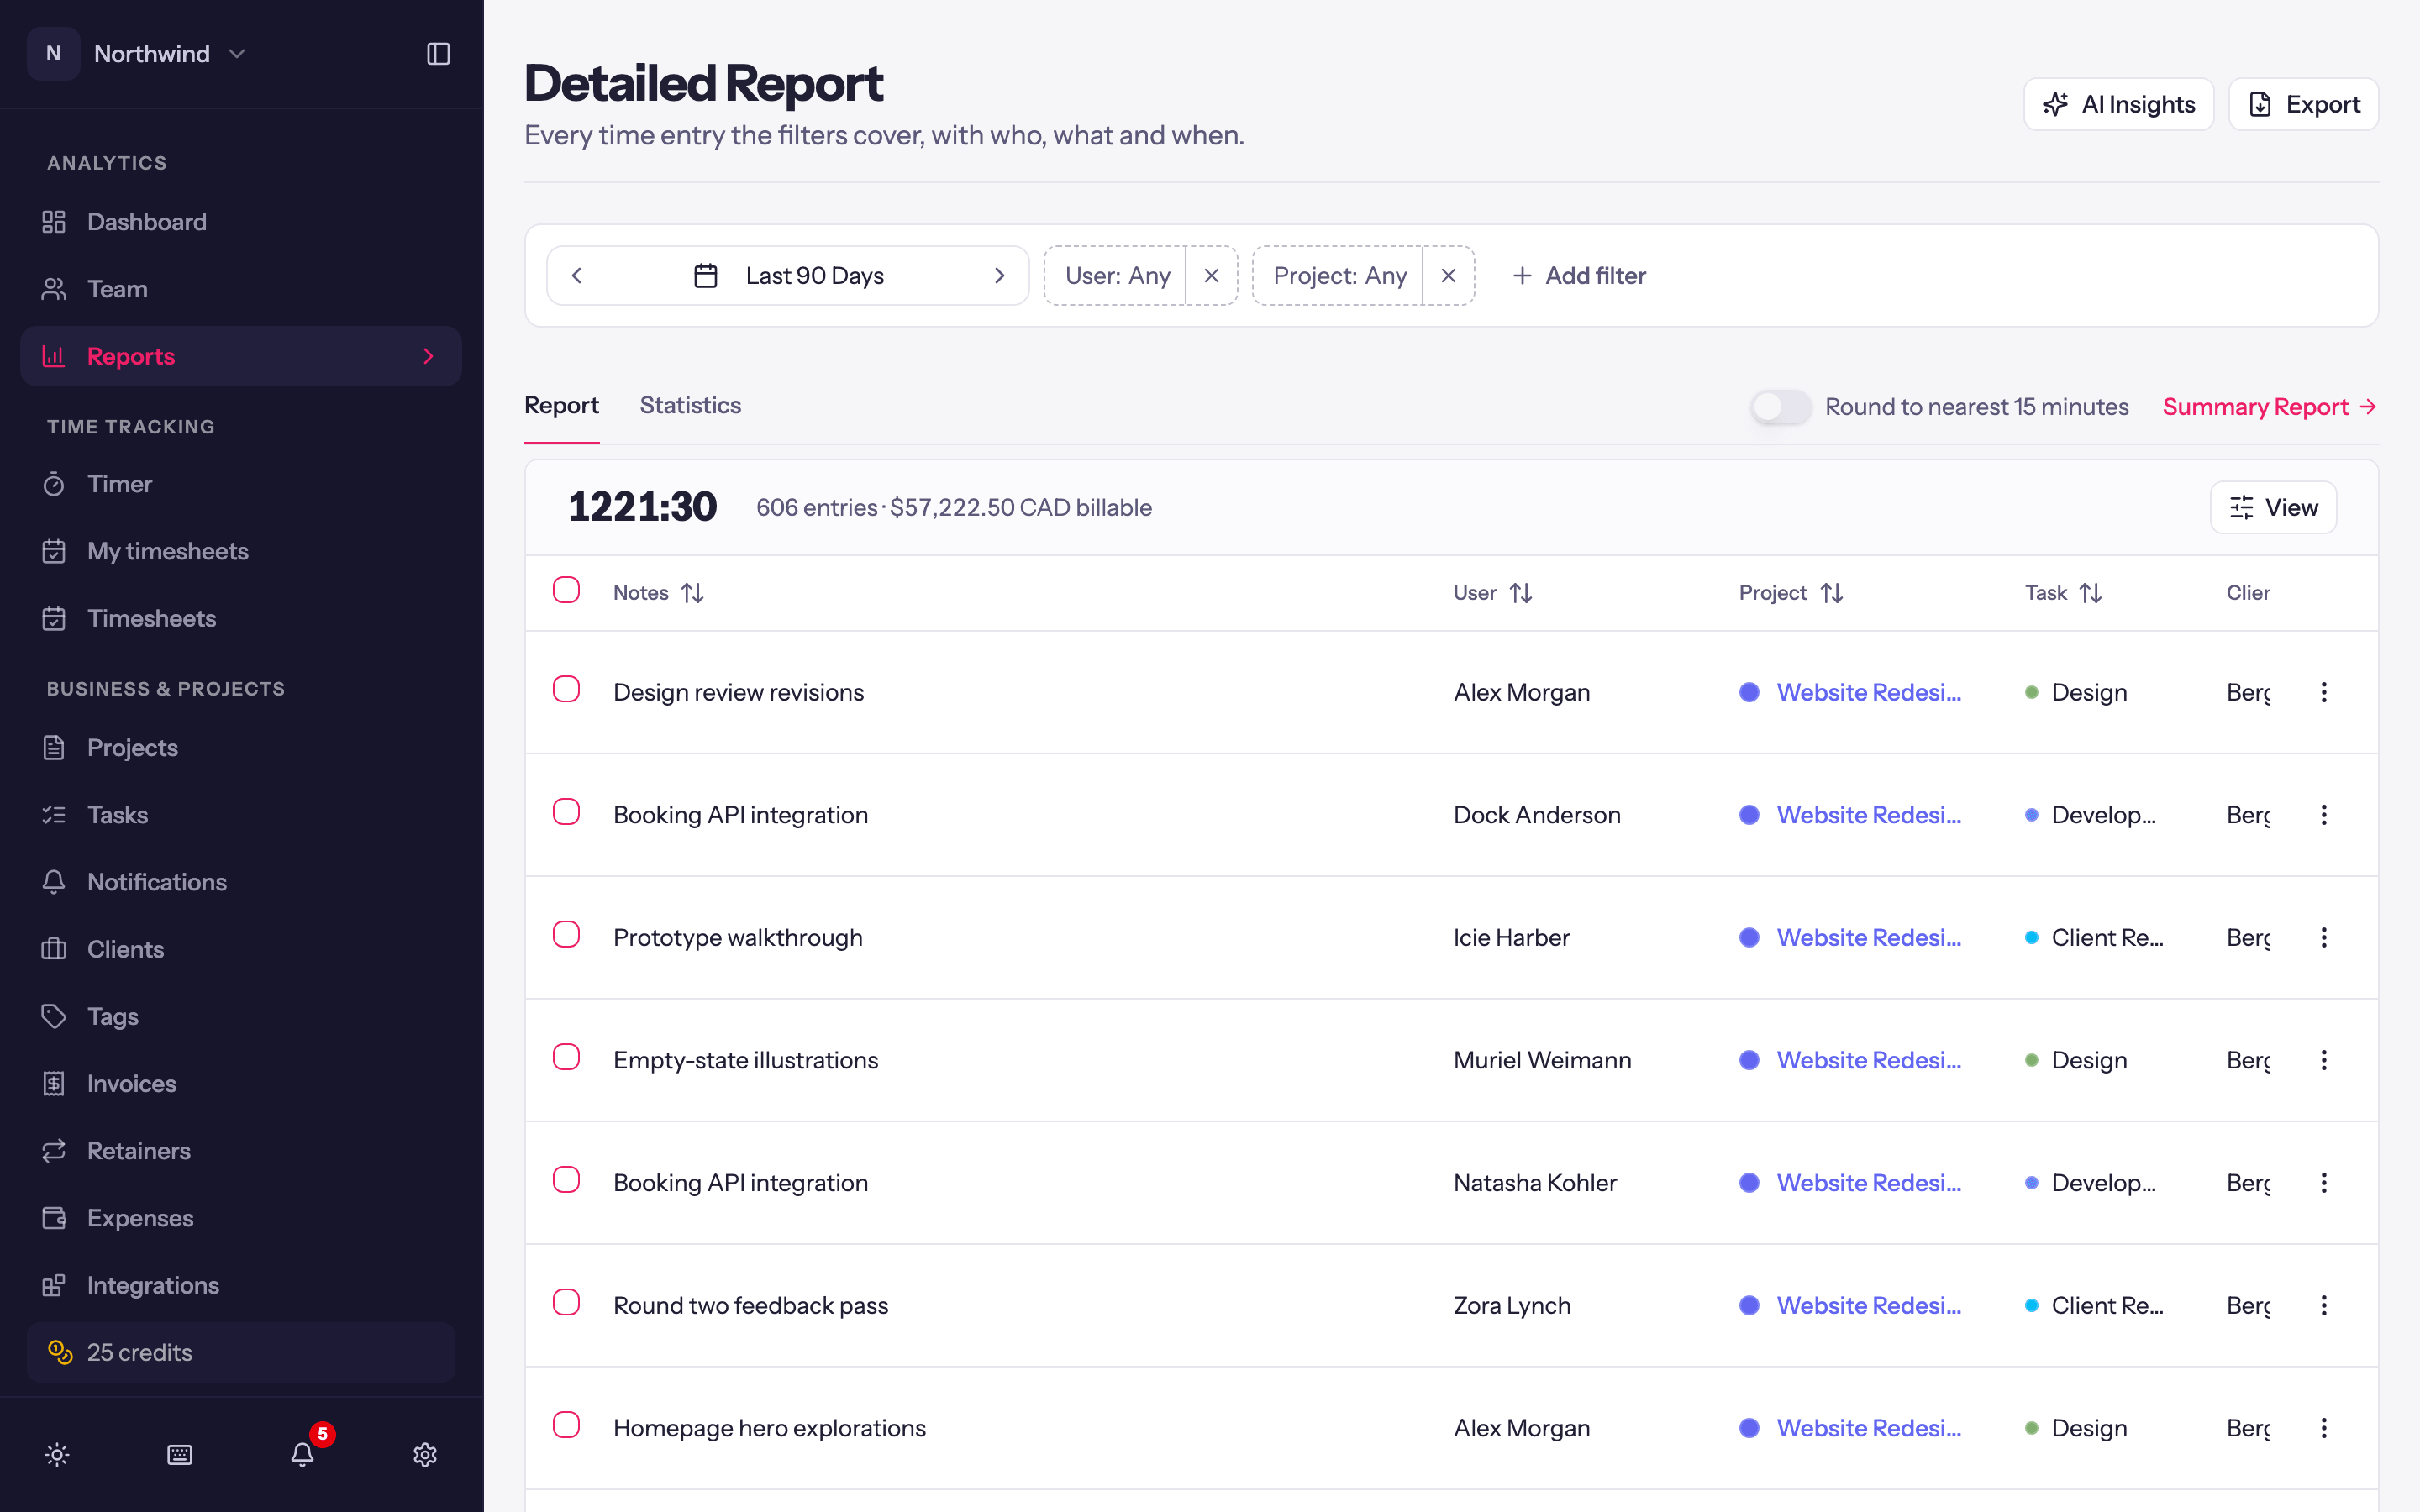
Filters
The date range sits on the left, with arrows to step back and forward a period. Each filter beside it is a chip: User, Project, Client, Task, Tag, Billable (Billable or Non-billable), Invoiced (Invoiced or Not invoiced), and Currency when the workspace bills in more than one. A first visit shows User and Project; + Add filter adds any of the others.
Click a chip to pick its values; the list has a search box when it's long, and User lists Active and Deactivated people separately. The × on a chip with a value clears it; on an empty chip it takes the chip off the bar. The chips you use are remembered for next time, on this browser and on both time reports, but what they were set to is not: every visit starts from Any. Reset clears every filter and returns the dates to the last 90 days.
Rounding is a switch in the tab row, named for the workspace's rule (for example Round to nearest 15 minutes). It changes every duration and total on the page, Statistics included, and Reset leaves it as it is.
The table
Columns: Notes, User, Project, Task, Client, Time and Duration. View → Columns adds Billable, Invoiced, Source (web, desktop, imported, API) and, for people allowed to see them, Billable Amount and Cost Amount; Notes always stays. Sort by any column header.
The row above the table gives the total duration, the number of entries and, for people who see revenue, what's billable. View also groups the rows By day or By person: click a group's row to fold it, or use Collapse all groups. Rows per page and the pager at the bottom move through long ranges.
Locked entries show a lock icon. The ⋯ menu on a row offers Edit (opens the full editor with billable, invoiced and rate overrides; see Editing entries), Delete, and Unlock for a locked entry.
The Report and Statistics tabs switch between the table and the period's totals (Total Profit, Total Revenue, Total Hours, Number of Time Entries) with a hours-by-week chart.
Bulk actions
Tick the checkbox on any row and a bar appears above the table showing how many entries are selected and what you can do with them. The checkbox in the header takes the whole page; when your filters match more than one page, Select all N matching extends the selection to every entry the filters cover, not just the page in front of you.
- Move to project… opens a picker: choose the project, and optionally a task on it. The entries are re-priced at the new project's rates and the budgets on both sides update. Tasks belong to the old project, so they are cleared unless you pick a new one.
- Mark as opens a menu: Invoiced elsewhere (they leave the uninvoiced report and are not offered when creating an invoice) or Not invoiced; Billable (rates are resolved from the project) or Non-billable (billable amounts are cleared); and Locked or Unlocked, each shown only if you hold that permission.
- Delete… removes the selected entries. It cannot be undone from the app.
- Clear drops the selection.
Every action asks first, naming the count. Entries that cannot change are skipped rather than blocking the rest, and the confirmation afterwards counts them with the reason: Marked as invoiced elsewhere 1,150 entries · 3 skipped: on an invoice. Entries on a Quanta invoice, in a submitted week, locked entries, and entries belonging to someone else are the usual skips.
Locking is how you freeze a month once it has been invoiced or paid out. See Locked entries.
Export
Export opens Choose export columns: tick what to include (Date, User, Email, Client, Project, Task, Description, Tags, Source, Duration, Billable, Invoiced, and the financial columns Currency, Billable Rate, Revenue, Cost Rate, Cost), choose the Format (Excel or CSV), Split name into first and last columns, and apply Rounding. Your column choice is remembered. Reset to defaults restores the standard set.
AI Insights
With AI on, the AI Insights button opens a chat panel over the currently filtered entries: "Which client took the most time last month?", "Summarise what Alex worked on this week". It suggests a few prompts, estimates the credits before running, and keeps each conversation so you can come back to it. See AI credits.