Summary report
Totals for the period grouped by client, project, user or task, with hours and money.
Analytics → Reports → Summary Report rolls the period up into one row per client, project, person or task. Users see their own time. Admins see everyone's. Other report-permission holders see everyone's on the projects that show it to them and only their own elsewhere; private projects they aren't on are left out unless their role has View every project.
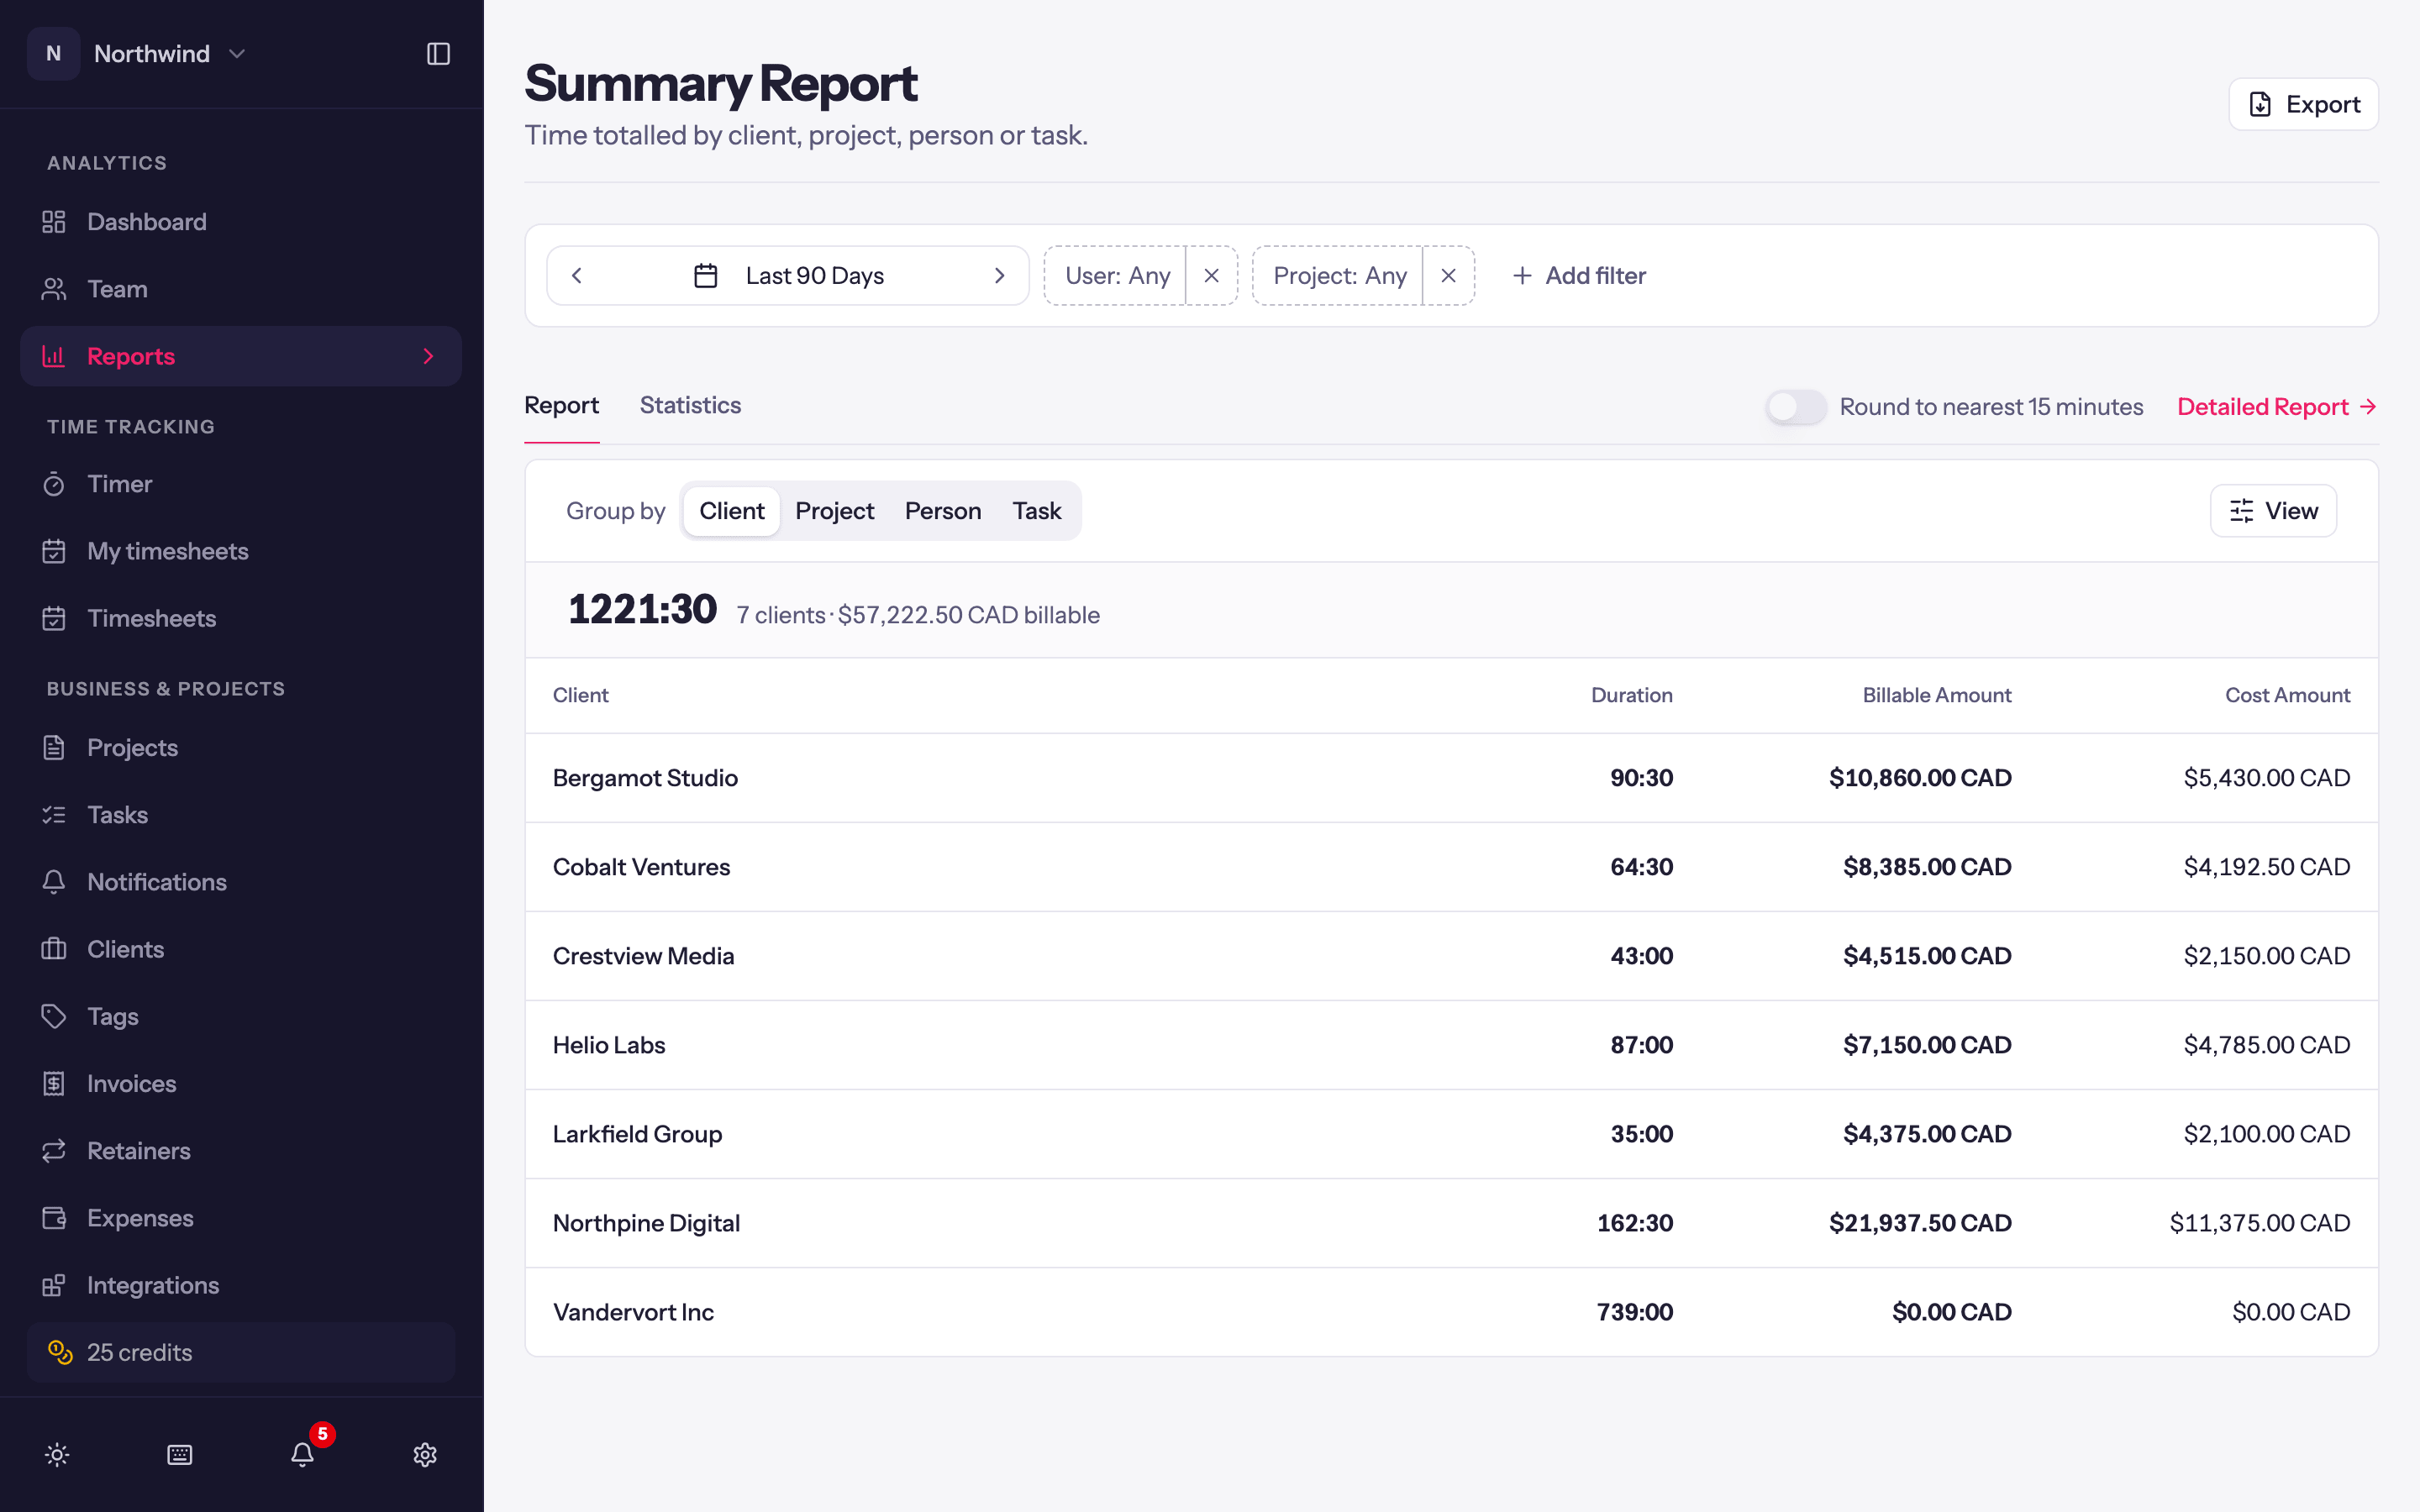
Controls
- The date range and its arrows, then the same filter chips as the Detailed report: User, Project, Client, Task, Tag, Billable, Invoiced and Currency, with + Add filter for the ones not showing. Reset clears them.
- Client, Project, Person and Task above the table choose what each row totals.
- The rounding switch in the tab row, named for the workspace's rule.
- Export downloads the time as an Excel file.
- Detailed Report jumps to the entry-level report with the same dates and filters.
Reading it
The row above the table gives the period's total duration, how many clients, projects, people or tasks it covers and, for people who see revenue, what's billable. Each row shows its Duration and, for report-permission holders, its Billable Amount and Cost Amount. A person's or task's time billed in more than one currency gets a row per currency, each naming its currency. Click a column header to sort.
The Statistics tab has the period's totals and a chart of Hours by Week or Month, with a Full breakdown you can expand. Hide revenue numbers there keeps the money off the screen.
Typical uses
- Monthly client review: last month, group by Client.
- Who did what on a project: filter to the project, group by Person.
- Where a person's week went: filter to the person, group by Project or Task.