Dashboard
A one-page view of the period: revenue, cost, hours, entries, who is working now, and per-project and per-person tables.
Analytics → Dashboard is the workspace overview. It needs the dashboard permission, which Admins have. Admins see the whole workspace. Anyone else with the permission sees what the projects would show them, as in Reports: the projects they can open, and other people's time where the project shows it to them. Revenue and cost need View revenue and View cost.
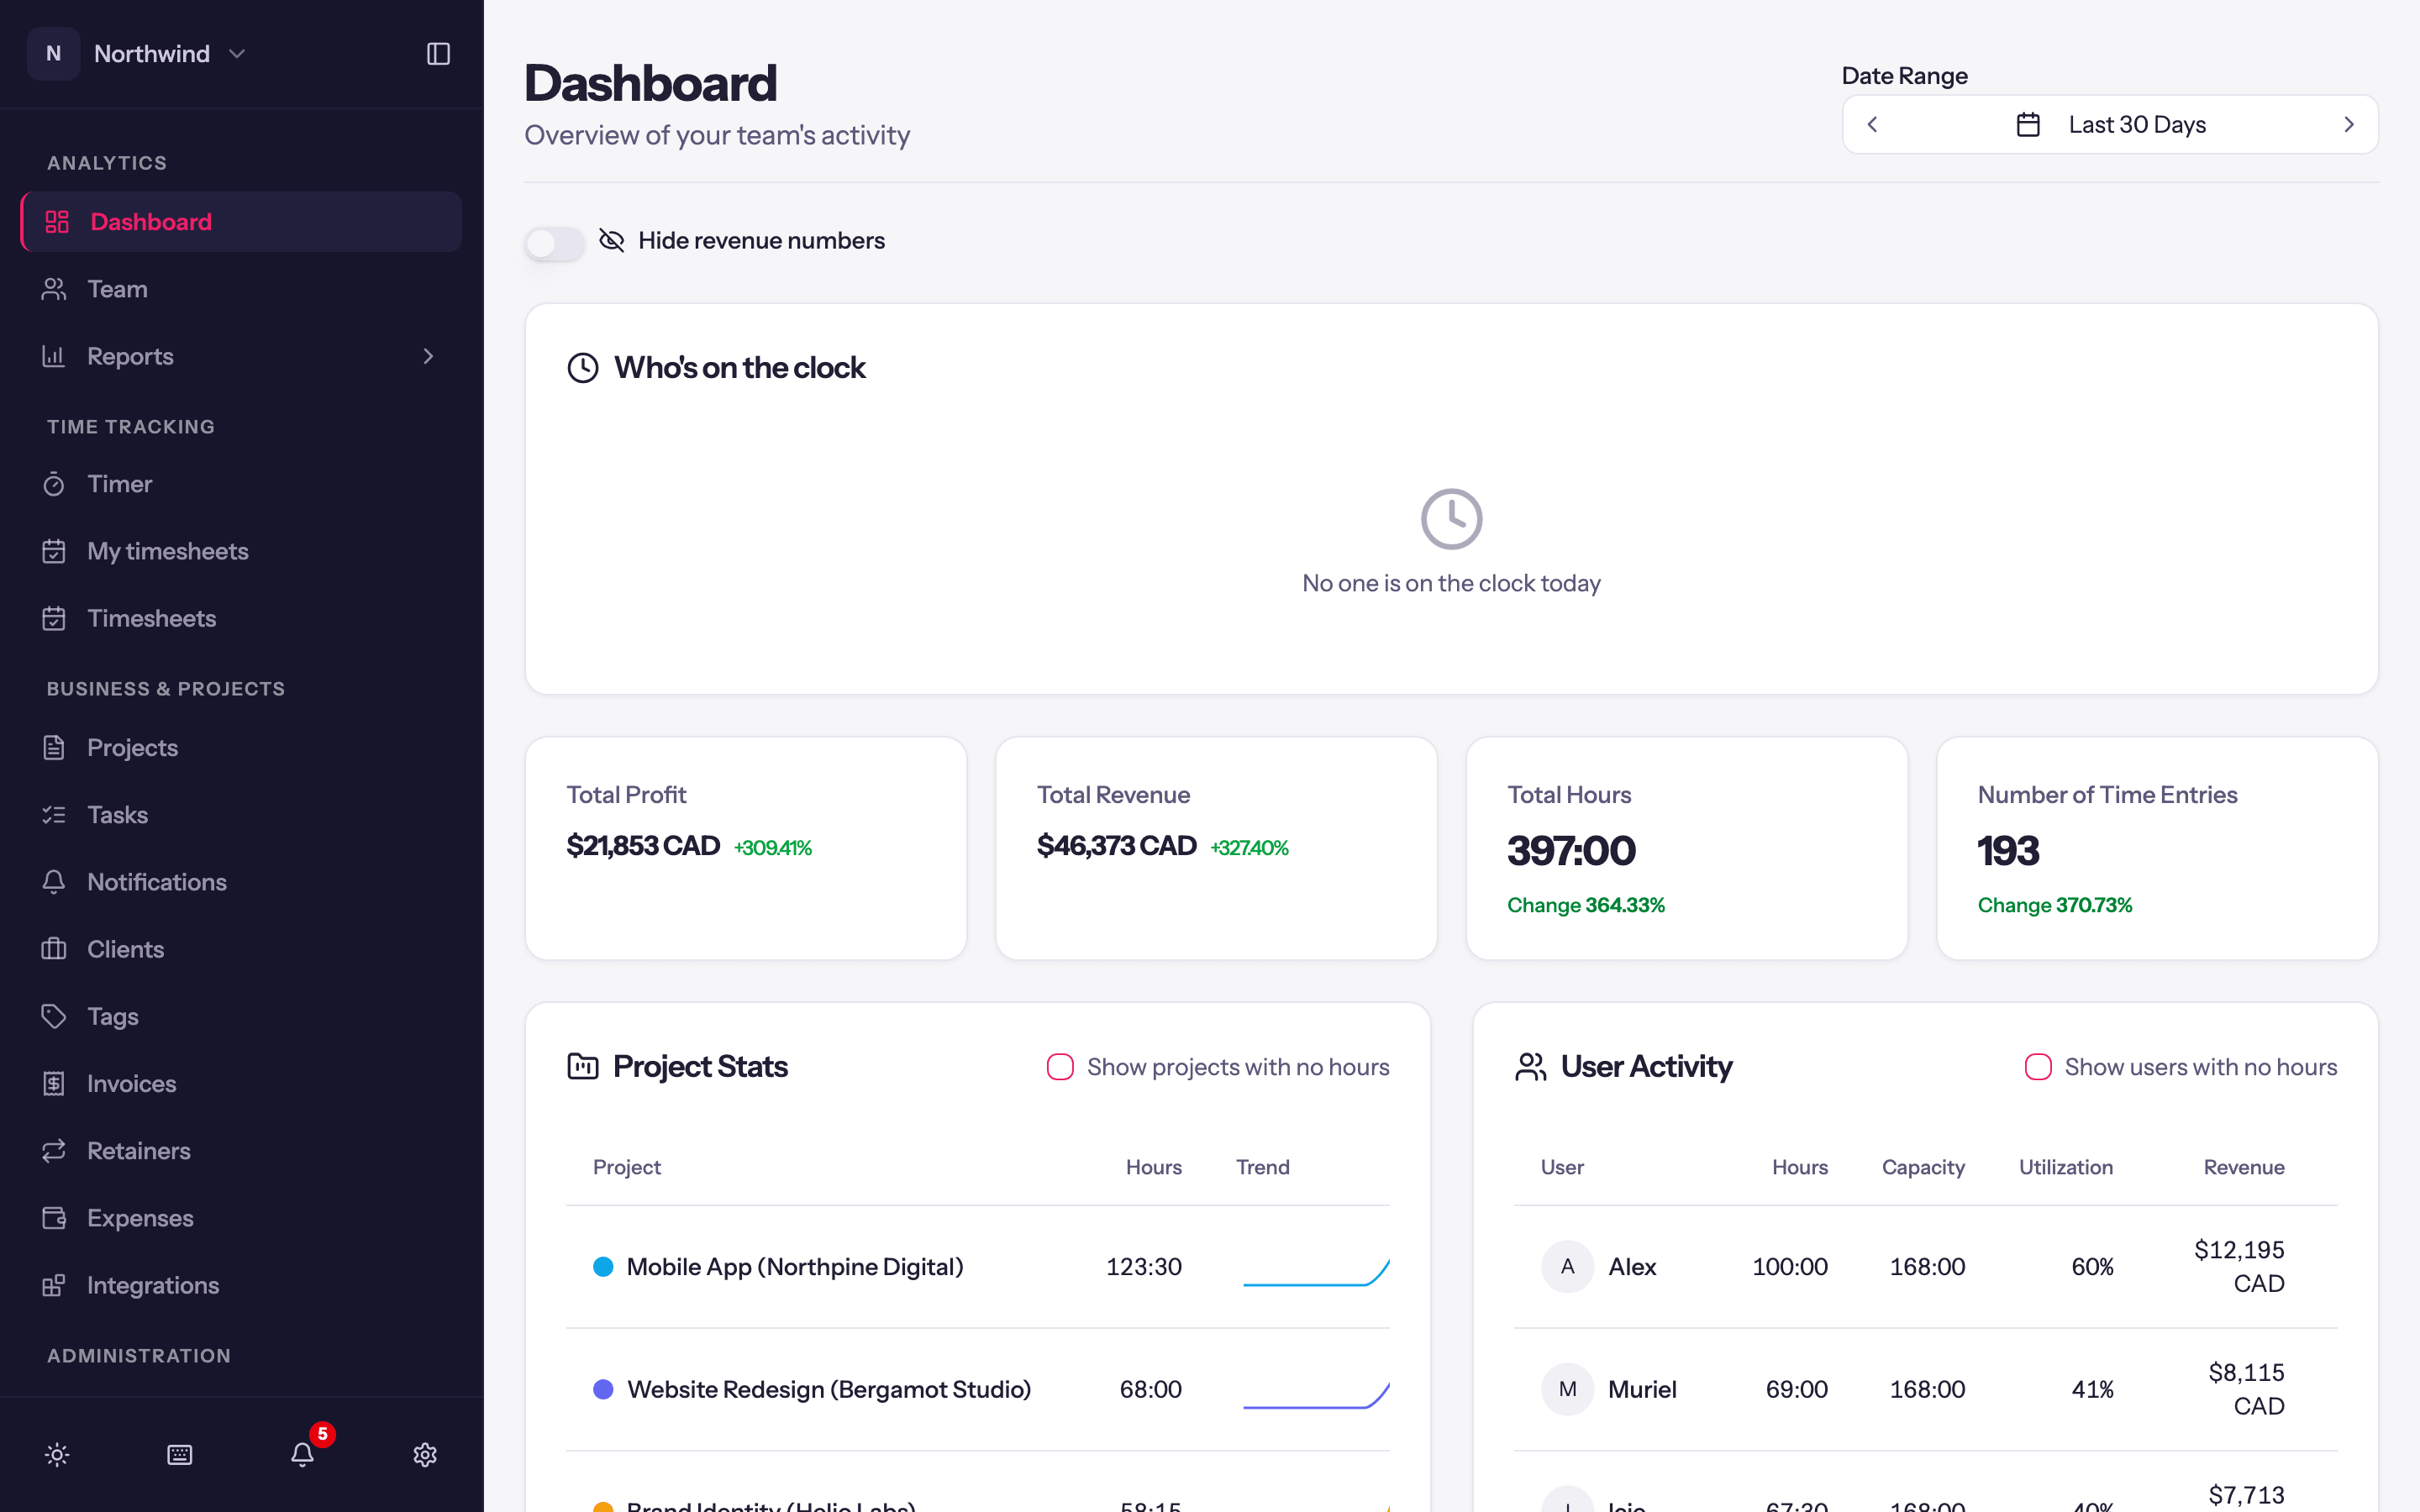
What is on it
- Date Range, defaulting to This Week, with arrows to step back and forth. Every figure below follows it.
- Headline figures: Total Profit, Total Revenue, Total Hours and Number of Time Entries for the period, each with the percentage change against the previous period of the same length.
- Who's on the clock: everyone with a timer running right now whose time you can see, with what they are working on and for how long. An Admin can Stop timer on someone's behalf (a forgotten timer on a Friday evening, say). No one is on the clock today when it is empty.
- Project Stats: one row per project with Hours, a Trend sparkline, Revenue and Profit. Show projects with no hours includes idle ones. Click a project to open its page.
- User Activity: one row per person with Hours, Capacity, Utilization, Revenue, Cost and Entries. Show users with no hours includes everyone. Click a person to open their timesheet.
Hide revenue numbers blanks every money figure on the page.
Reading utilization
Utilization is tracked hours divided by the person's weekly capacity, scaled to the period. Capacity comes from the person's record (Users → edit → weekly capacity) or the workspace default (Workspace Settings → General); see Team.